UI glossary (terminology)#
Audience: everyone (this is the shared vocabulary)
Time: 10–20 minutes (skim now, return later)
What you’ll get: exact meanings of UI terms so the rest of the docs feel predictable
How to use this page#
If you’re new: read the bold terms only.
If you’re debugging something subtle: read the “Scope / persistence” notes under each section.
Tip
This glossary is written to match the app UI language, even when a “technical” term might be more precise. The goal is: when the docs say “view” or “snapshot”, you know exactly what screen element/state is meant.
UI map (one screenshot you’ll reuse everywhere)#
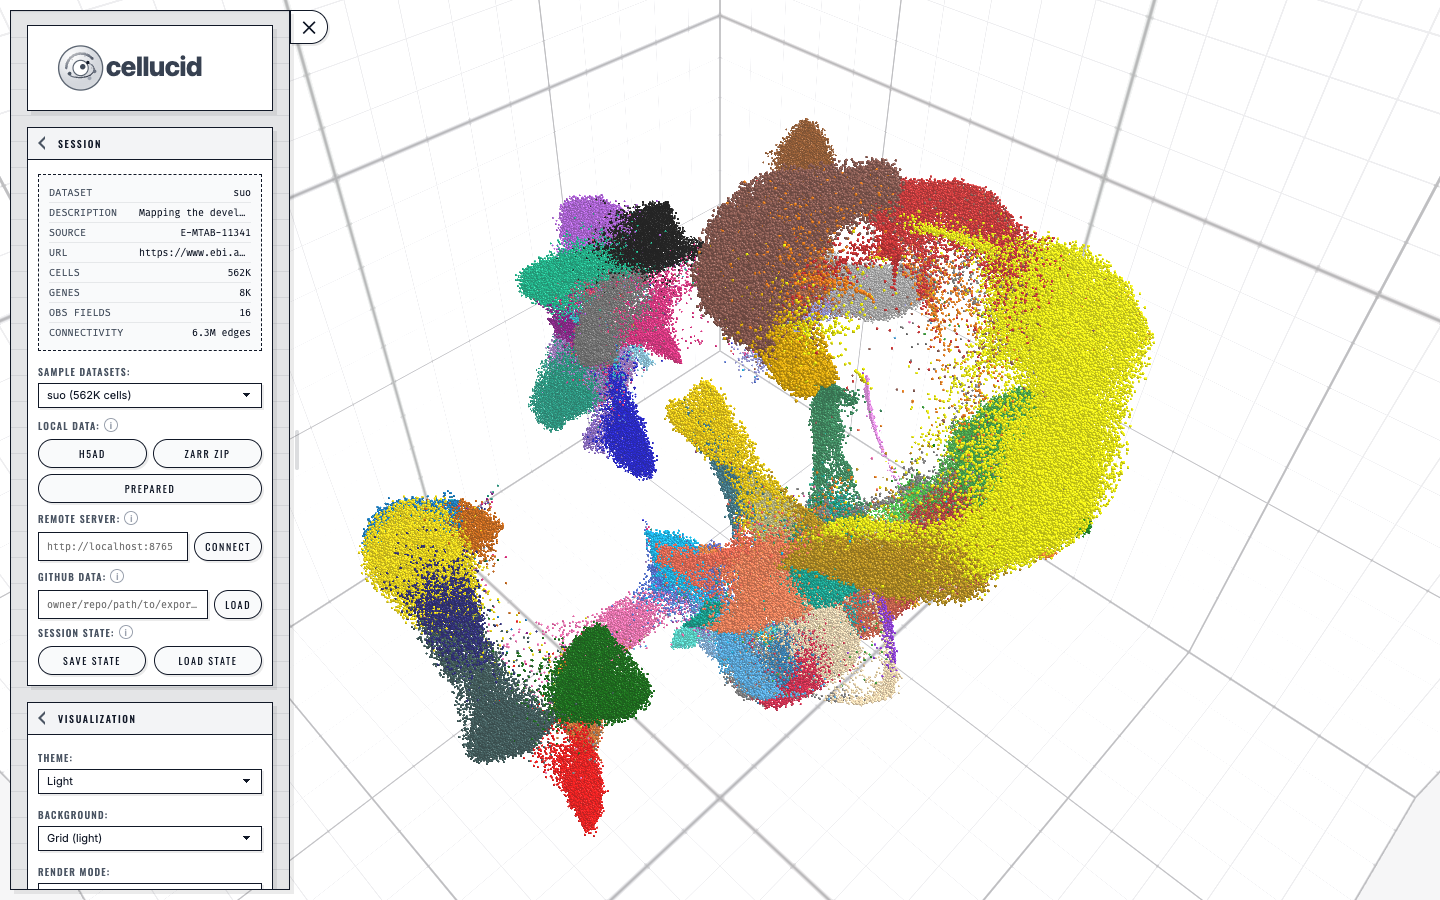
A loaded dataset in Cellucid: the sidebar controls the active view while the categorical legend maps directly to the colored points.#
Startup and build identity#
Welcome overlay: the modal shown on every ordinary bundled or catalog startup. Its dismissal is not remembered for the next ordinary load. Choose a dataset opens the data controls; Escape dismisses it for the current load. Explicit Jupyter, remote-server, and GitHub-served startup links skip it because they already declare a data source.
Suo: the sample catalog default. It may finish loading behind the welcome overlay before you choose another source.
Default background: light grid in a fresh browser profile. A user-selected background remains an explicit preference.
Build: the web build identity printed in the sidebar footer. Include this exact value in bug reports so maintainers can identify the HTML, JavaScript, CSS, and asset inventory you exercised. It is not the Python or R package version.
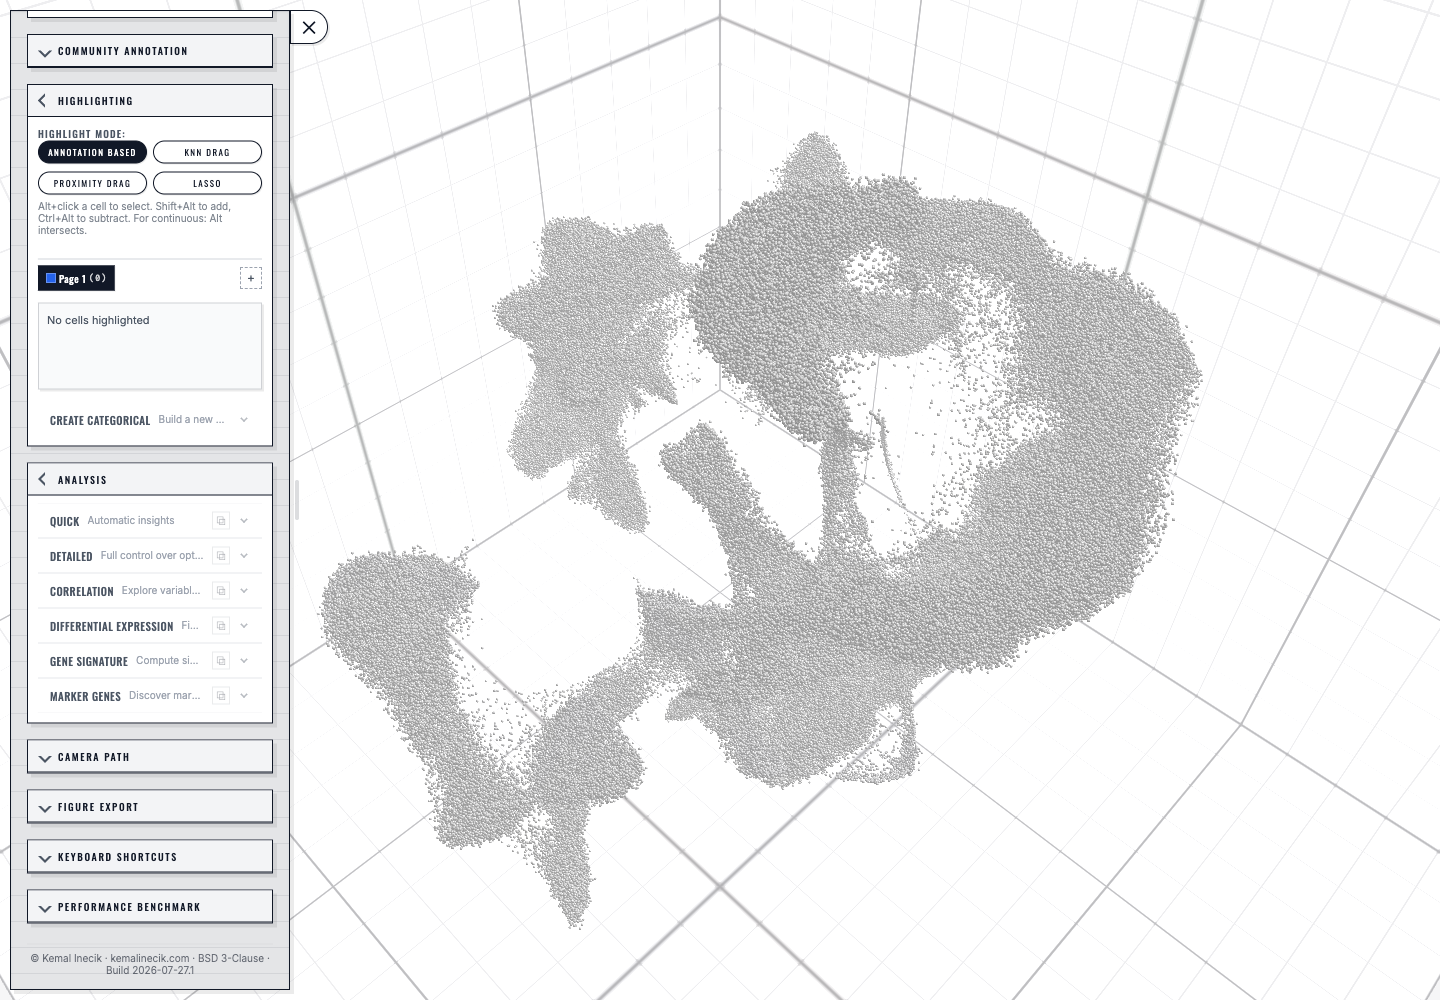
Fresh startup after closing the welcome overlay: Suo is loaded on the light grid, Community Annotation and Camera Path are collapsed, and the footer identifies this capture as Build 2026-07-27.1.#
Data model terms#
Dataset: the loaded data bundle (points + metadata + optional gene expression + optional connectivities/vector fields).
Cell / point: one row/observation rendered as a point. (The UI often says “points” because the viewer is generic.)
Gene / feature: one variable/feature; used for gene expression coloring and some analyses.
Embedding: coordinates for points in 1D/2D/3D (UMAP/tSNE/PCA/etc).
Dimension (1D / 2D / 3D): which embedding dimensionality you are currently viewing for a given view.
Connectivity: a neighbor graph (edges). When enabled, edges are drawn between visible points only.
Vector field / velocity overlay: an optional overlay that visualizes per-cell vectors (dimension-specific).
Fields, coloring, and legends#
Field: something you can color by.
Categorical obs: discrete labels (clusters, batch, sample).
Continuous obs: numeric values (QC metrics, scores).
Gene expression / var: expression of a selected gene/feature.
Active field: the currently selected field that drives coloring (per view).
Legend: the UI element that explains the current coloring.
Categorical legend shows categories and their colors.
Continuous legend shows a numeric color scale.
Color-by: the act of selecting a field to drive coloring.
Scope note:
In multiview, the “active field” is typically per view (each view can show a different coloring).
Views, snapshots, and “small multiples”#
These terms are the most important for understanding Cellucid.
View: one panel that renders the dataset with its own state (camera, dimension, coloring, filters, highlights).
Live view: your default working view (often labeled “All cells” in the view badges).
Snapshot view (also “kept view”): a view created by clicking Keep view; used to compare multiple states side-by-side.
Multiview: the overall feature of having multiple views/snapshots.
View layout
Grid compare: shows all views in a grid.
Edit selected view: shows only the active view so you can edit it precisely.
Active view: the view you are editing/configuring (the one selected in the view badges).
Focused view: in grid mode, the view under your last click; this determines which view the camera controls target.
View badge: the clickable pill/row representing a view (with indicators like
3D,Orb/Pan/Fly).Cameras locked: all views share one camera (navigation is synchronized).
Cameras unlocked: each view has its own camera and navigation mode; badges show per-view navigation indicators.
Scope note:
When cameras are unlocked, Cellucid stores camera state per view and switches it when you focus a different view.
Highlighting and selection terms#
Highlight mode: the active interaction tool for selecting points (e.g., lasso).
Highlight group: a named set of highlighted cells (used for comparison/analysis).
Highlight page: a collection of highlight groups (useful when you want multiple “sets” of groups).
Scope note:
Highlights can be global or per-view depending on the feature; always check the page you’re using (highlighting is documented under
f_highlighting_selection/index).
Analysis and export terms#
Analysis: computations driven by the current dataset state (often highlights/groups).
Figure Export: export an image/vector figure of the current view(s) suitable for papers.
Save State / Load State: save/restore a
.cellucid-sessionbundle that captures the application state.
Scope & persistence vocabulary (used throughout the docs)#
Global: one value shared across the entire app/dataset (not specific to a view).
Per view: stored separately for each view/snapshot.
Session bundle: a saved
.cellucid-sessionfile (explicit user action).Local storage: persistent browser storage used for small preferences (e.g., theme/background).
Session storage: storage that is cleared when the tab closes (used for sensitive tokens like GitHub OAuth in community annotation).
Next steps#
Choose a workflow:
a_orientation/05_which_workflow_is_for_me_decision_treeLearn navigation + multiview:
c_core_interactions/index