Analysis mode: Gene Signature (Gene Signature Score)#
Audience: wet lab + computational users (gene program scoring)
Time: 20–40 minutes
What you’ll learn:
What a gene signature score represents (in Cellucid terms)
How Cellucid computes the score (mean/sum over genes; per-cell)
How normalization options change interpretation (z-score/min-max)
How to avoid the most common signature failures (missing genes, formatting, scale confusion)
Prerequisites:
A dataset loaded
Gene expression available
A gene list (“signature”) to score
What a gene signature is (user-facing)#
A gene signature is a curated gene list meant to represent a biological state, pathway, or cell program.
Cellucid turns a signature into a per-cell score:
one number per cell,
which can be compared across highlight pages (groups).
Intuition for wet lab users:
a high score means “many genes in the program are high (on the dataset’s expression scale)”,
a low score means “the program is not expressed strongly in these cells”.
Inputs (genes + pages)#
1) Signature genes input#
In Analysis → Gene Signature, you paste genes into Signature Genes.
Important formatting rule:
Gene lists are parsed as comma-separated values (e.g.,
CD3E, CD4, IL7R).
Important
Newline-only lists are not reliably parsed.
If you paste one gene per line, also include commas or convert to comma-separated format.
Gene matching rules (practical):
matching is exact to the dataset’s gene keys,
no alias mapping is applied (e.g., symbol ↔ Ensembl),
case sensitivity depends on your dataset’s gene keys (treat it as case-sensitive).
2) Pages (“Compare pages”)#
You select pages under Compare pages:. By default, if you have pages and haven’t selected anything, the UI will often start by selecting all pages.
Gene Signature supports derived pages:
Rest of <page> for one-vs-rest comparisons.
Scoring algorithm (exact)#
For each selected page, Cellucid computes a score for each cell in that page.
Let G be the set of genes you entered.
For each cell i:
collect the finite expression values
x_{i,g}for all requested genesg ∈ Gcompute:
Mean expression: arithmetic mean of the finite values
Sum expression: sum of the finite values
Median expression: middle sorted value, or the mean of the two middle values when the count is even
Notes:
Every requested gene must resolve for every selected page and cell arrays must align exactly; a missing or misaligned payload terminates the analysis.
If a cell has zero finite gene values, its score becomes NaN and is excluded from summary statistics and plots.
Note
Signature scores are computed on the expression values present in your dataset.
If your dataset stores log-normalized expression, the score is on that scale. If your dataset stores counts, the score is on the count scale.
Normalization options (what they do)#
After scoring, you can normalize the scores:
None: keep scores as computed
Z-score: transform scores to
(x - μ) / σusing μ and σ computed across all selected pages combinedMin-Max (0–1): transform scores to
(x - min) / (max - min)using global min/max across all selected pages combined
Practical implication:
normalization makes scores more comparable across pages within the current analysis run,
but it also changes the meaning of “high score” (especially z-score).
Outputs and interpretation#
You’ll typically see:
A distribution plot per page (violin/box/histogram depending on your selection)
A per-page summary table (mean/median/std + number of cells with valid scores)
A “Genes in Signature” list (chips) so you can verify inputs
Interpretation guidance:
Compare effect size (how separated are distributions) before staring at p-values.
If two pages differ strongly, check whether the signature is really a program or just a proxy for cell type composition.
Statistical tests:
When you have ≥2 pages selected, the modal can show the same style of distribution-comparison tests used for continuous variables in Detailed mode. Treat these as exploratory.
The Mann–Whitney result card reports whether its p-value is exact or asymptotic. For analysis-wide scope and assumptions, see Analysis mental model (Pages, Variables, Scope).
Export (CSV)#
Gene Signature exports a CSV named like gene_signature_scores.csv containing:
pagescore
Important limitations:
exported rows do not include cell indices/IDs, so the file is not directly joinable back to AnnData without additional context.
If you need per-cell mapping:
compute the signature in Python and attach it to
adata.obs, orexport a per-cell table through your own workflow.
Edge cases and pitfalls#
Unknown gene: scoring terminates; correct the gene list before rerunning.
Duplicate genes in the list: duplicates effectively up-weight that gene (it is added multiple times).
Huge signatures (hundreds of genes): can be slow and may stress browser memory.
Housekeeping-dominated signatures: scores track library size/QC rather than biology.
Troubleshooting (Gene Signature)#
Symptom: “Everything is empty / no valid values”#
Likely causes:
gene expression is not available in this dataset/loading method,
gene keys don’t match (symbols vs Ensembl, case mismatch),
signature input formatting is wrong (newline-only or extra punctuation).
How to confirm:
try a single known gene (e.g.,
MS4A1) as a “signature” and see if it produces non-empty output.
Fix:
correct gene identifiers to match your dataset,
ensure comma-separated input,
load the dataset with gene expression (see Data Loading in the Web App (All Paths)).
Interface reference#
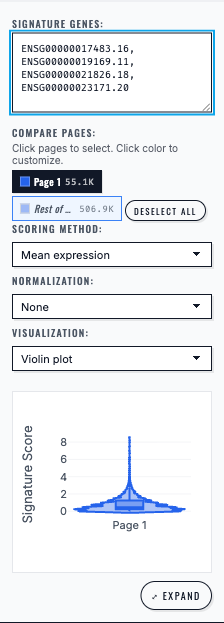
Gene Signature analysis computes and plots the selected multi-gene score for the chosen cell group.#
Next steps#
Analysis mode: Marker Genes (Genes Panel) (marker discovery across categorical groups)
Exporting analysis results (export signature results)
Troubleshooting (analysis) (missing genes, missing expression)