Analysis UI overview#
Audience: everyone (wet lab + computational + power users)
Time: 15–25 minutes
What you’ll learn:
Where Analysis lives and what it depends on (highlight pages)
How the mode accordion behaves (open/close; one mode at a time)
Which modes auto-run vs require a “Run” button
How “Copy” creates floating analysis windows (what is copied vs recomputed)
Where exports live (CSV) and where plot options live (modal/expanded view)
Prerequisites:
A dataset loaded in the web app
At least one highlight page (recommended for nearly all modes)
Where Analysis lives (UI map)#
In the left sidebar, Analysis is a dedicated accordion section:
Sidebar → Analysis (directly below the Highlighted Cells / highlight pages UI).
Analysis is intentionally placed right after highlighting because:
you define groups with highlight pages, and
you analyze/compare those pages here.
If Analysis looks empty, the first thing to check is whether you have highlight pages: see Highlighting and Selection (Groups, Pages, Tools).
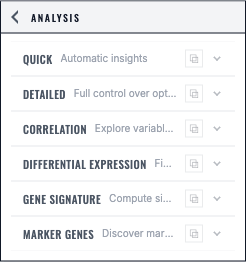
The Analysis mode accordion (how it behaves)#
Inside the Analysis section you’ll see a mode accordion with these items:
Quick (automatic composition + stats summaries)
Detailed (choose a variable + plot type + options)
Correlation (choose X and Y variables; scatter plot + stats)
Differential Expression (compare two pages; volcano plot + gene table)
Gene Signature (paste gene list; score across selected pages)
Marker Genes (discover one-vs-rest markers for a categorical obs field)
Accordion behavior:
Only one mode can be open at a time.
Clicking an already-open mode closes it.
Closing the mode hides results in the sidebar; reopening triggers a refresh if inputs changed.
Page selection UI (“Compare pages”)#
Most modes include a page selector labeled Compare pages:.
What you can do there:
click tabs to select which pages are included,
see per-page cell counts,
customize page colors (used consistently in plots),
select all/deselect all quickly.
Some modes also show derived pages:
Rest of <page> (the complement of a page across the full dataset).
Tip
When a plot “doesn’t match what you expect”, the most common cause is selecting the wrong pages. Always confirm which pages are selected in the mode you’re currently using.
Variable selection UI (obs vs genes)#
Detailed mode#
Detailed uses a two-step variable selector:
choose the type: Categorical obs / Continuous obs / Gene expression
choose the specific variable (field key or gene)
If gene expression is not available in the dataset, the selector will show an explicit “No gene expression data available” message.
Correlation mode#
Correlation uses two selectors:
X Axis Variable: (continuous obs or gene)
Y Axis Variable: (continuous obs or gene)
It also includes:
Color by: (optional categorical obs; otherwise points are colored by page)
Correlation method: Pearson (linear) or Spearman (rank)
Preview vs expanded (“modal”) views#
Many modes show a compact preview in the sidebar, plus an Expand/modal view with:
plot options (thresholds, styling, density contours, etc.),
summary stats tables,
statistical annotations/tests (where applicable),
export actions (download CSV).
When documenting a mode, assume users will spend most time in the modal view for:
reading tables,
adjusting thresholds,
and exporting.
“Copy” (floating analysis windows)#
Each analysis accordion item has a small Copy control.
Copy creates a floating analysis window so you can:
keep one result visible while exploring another mode, or
run the same mode with different settings side-by-side.
Important behavior:
Settings are copied. Results are not copied.
The copied window recomputes from current data/pages.Floating windows have their own UI instance, so they can be configured independently.
There is a safety cap on the number of open analysis windows (to prevent memory explosions).
Sessions (what restores)#
If you save/restore a session:
floating analysis windows can be reopened with their geometry and settings,
heavy analysis caches (notably bulk gene caches) may be restored lazily to speed up gene-heavy modes,
results may still recompute depending on what the mode needs and what changed.
See Session Saving, Restoring, and Sharing for session semantics.
Interface reference#
The Analysis panel exposes six explicit modes, each with its own validated inputs and result area.#
Next steps#
Analysis mode: Quick (automatic composition + stats) (Quick: composition + stats at a glance)
Analysis mode: Detailed (variable + plots + statistical tests) (Detailed: variable + plot type + statistical tests)
Exporting analysis results (what exports exist and what they contain)