Analysis mode: Marker Genes (Genes Panel)#
Audience: everyone (especially computational users; wet lab-friendly for interpretation)
Time: 25–60 minutes
What you’ll learn:
How Marker Genes discovers one-vs-rest markers for many groups at once
How grouping works (categorical obs field → groups)
How to interpret log2FC, p-values/FDR, and percent-expressing
How Ranked vs Clustered vs Custom modes differ
How caching and performance settings affect runtime
Prerequisites:
A dataset loaded
Gene expression available
At least one categorical obs field that can define groups (e.g.,
cell_typeorcluster)
What Marker Genes is for#
Marker Genes is the “many groups” marker discovery tool.
Use it when you want:
marker genes for each cell type/cluster in a categorical field,
a heatmap view of those markers across groups,
and an exportable marker table.
How it differs from DE:
Analysis mode: Differential Expression (DE) (Page A vs Page B) compares two pages (A vs B).
Marker Genes computes one-vs-rest markers for every group in a categorical obs field.
Inputs (what you choose)#
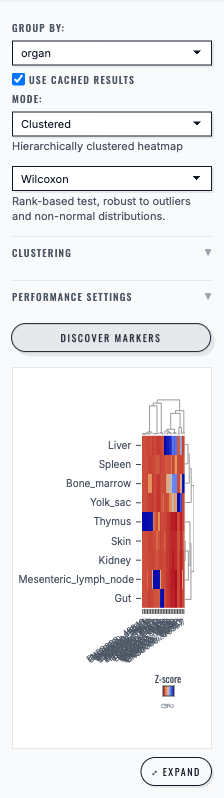
1) Group By (categorical obs field)#
You pick a categorical obs field under Group By: (e.g., cell_type).
Cellucid then builds groups as:
one group per category label (e.g.,
B cell,T cell, …),across the full dataset (not highlight pages).
Important behaviors:
cells with the declared missing-code sentinel are excluded from grouping,
an out-of-range or otherwise undeclared category code stops the run with an explicit data-contract error,
groups are sorted by size (largest first) for stable UI.
2) Mode#
Marker Genes supports three modes:
Ranked Genes: show ranked marker lists per group
Clustered: build a marker heatmap and cluster genes/groups
Custom Genes: skip marker discovery; visualize a user-supplied gene list across groups
3) Statistical method#
Wilcoxon (default): rank-based test, robust to outliers
t-test: Welch’s t-test (mean comparison)
4) Use cached results#
If enabled, Cellucid can reuse cached marker results for the same dataset + group-by field + settings. This can make repeated runs much faster.
5) Performance Settings (collapsible)#
Marker discovery can be heavy. The same performance controls used by DE apply here:
batch size, memory budget, network parallelism, and compute parallelism.
Statistics (what is computed)#
Marker discovery is one-vs-rest per group.
For each group g and each gene:
“in-group” = cells in group
g“out-group” = all other cells (with valid group labels)
For each gene and group, Cellucid computes (conceptually):
meanInGroup,meanOutGrouplog2FoldChange = log2((meanInGroup + 0.01) / (meanOutGroup + 0.01))pValue(Wilcoxon U or Welch t-test)adjustedPValuevia Benjamini–Hochberg (computed per group across genes)percentInGroup,percentOutGroup= percent of cells with expression> 0
Wilcoxon always uses exact, tie-aware ranks. For low-cardinality values (including quantized prepared data), Cellucid aggregates exact counts per distinct value; high-cardinality values use an exact index sort. Its p-value is exact only when both comparison groups contain fewer than 50 finite values and there are no ties; otherwise inference uses the exact U statistic with a tie- and continuity-corrected asymptotic reference distribution. See Analysis mental model (Pages, Variables, Scope) for analysis-wide scope and assumptions.
Markers are filtered by thresholds (typically controlled in the expanded view):
p-value/FDR threshold (default ~0.05)
|log2FC| threshold (default ~1.0)
and whether to use adjusted p-values by default
Outputs (what you see)#
Ranked Genes mode#
Select a group from a dropdown.
View the top markers for that group.
Use Expand (modal) for the full table and exports.
Clustered mode#
A heatmap of genes (rows) vs groups (columns).
Optional clustering of rows/columns (distance + linkage choices).
Plot options usually include:
p-value threshold / log2FC threshold
use adjusted vs raw p-values
transform (e.g., z-score/log1p) and colorscale choices
Custom Genes mode#
You provide genes.
Cellucid builds an expression matrix for those genes across groups.
No p-values are computed (because this mode is visualization, not discovery).
Export (CSV)#
Marker Genes exports depend on what you’re viewing:
Heatmap CSV:
genecolumn + one column per group (matrix values)Ranked markers CSV:
group,gene,rank,log2FoldChange,pValue,adjustedPValue,meanInGroup,meanOutGroup,percentInGroup,percentOutGroup
Use exports when you need:
reproducible reports,
downstream filtering in R/Python,
figure preparation outside the app.
Edge cases and pitfalls#
Small groups can block the whole run#
Marker discovery enforces a minimum group size (default ~10 cells). If any group is below the minimum, the run can fail.
Workarounds:
choose a different categorical field (coarser grouping),
merge rare categories into “Other” in preprocessing,
create a derived categorical field that excludes rare categories.
No markers found#
Common causes:
thresholds too strict,
groups are extremely similar,
gene expression scale is inappropriate for the test (e.g., already heavily transformed),
missing gene expression.
Caching confusion#
If “Use cached results” is enabled:
reruns may return instantly with the same markers. Disable caching if you suspect you changed the underlying dataset or want a fresh recompute.
Troubleshooting (Marker Genes)#
Symptom: “No categorical fields available”#
Cause:
dataset has no categorical obs annotations.
Fix:
export/load a dataset with cluster/cell type labels (obs categorical).
Symptom: “Group ‘X’ has only N cells. Minimum required: 10.”#
Cause:
at least one category is too small for robust marker discovery.
Fix:
merge rare categories or choose a different group-by field (see Edge cases above).
Symptom: “Analysis is very slow / browser becomes unresponsive”#
Fix:
reduce Performance Settings (lower batch size, lower parallelism) to avoid memory pressure,
keep fewer tabs/windows open,
consider server mode for large datasets (data loading + memory stability).
Interface reference#
Marker Genes ranks candidate genes for the selected group and exposes an expanded result view.#
Next steps#
Analysis mode: Differential Expression (DE) (Page A vs Page B) (two-page DE with volcano plot)
Exporting analysis results (what each mode exports)