Analysis mode: Quick (automatic composition + stats)#
Audience: everyone (wet lab + computational)
Time: 10–20 minutes
What you’ll learn:
What Quick mode summarizes (and what it deliberately does not)
How Dynamic vs Manual page selection works
How to interpret the two Quick sections: Composition and Statistics
Common failure modes (“nothing shows up”, “wrong page”, “missing fields”)
Prerequisites:
A dataset loaded
At least one highlight page (Quick can follow the active page automatically)
What Quick mode is for (and what it is not)#
Quick mode is the “sanity check / first glance” analysis:
Composition: “What labels make up these cells?” (categorical obs)
Statistics: “What are typical QC/score values here?” (continuous obs)
Quick mode is intentionally:
fast (minimal configuration, no “Run” button),
robust (uses approximate statistics for very large pages),
obs-focused (cell metadata), not gene-level hypothesis testing.
Quick mode is not for:
gene–gene or field–gene relationships → use Analysis mode: Correlation (X vs Y across pages)
differential expression → use Analysis mode: Differential Expression (DE) (Page A vs Page B)
marker discovery across many groups → use Analysis mode: Marker Genes (Genes Panel)
Inputs and scope (what cells does it summarize?)#
Quick mode summarizes highlight pages.
Dynamic mode (default): “follow the active page”#
By default, Quick uses Dynamic mode:
it always summarizes the currently active highlight page,
switching pages in Highlighted Cells updates Quick automatically.
Manual mode: “combine pages intentionally”#
Quick also supports manual selection:
you choose one or more pages,
Quick summarizes the union of those pages.
Note
Quick mode summarizes across the selected pages as one combined set.
If you want side-by-side per-page comparisons with statistical tests, use Analysis mode: Detailed (variable + plots + statistical tests).
Filtering note (visibility vs membership)#
Quick uses page membership (stored cell indices), not canvas visibility. If you expected filters to affect analysis, see Analysis mental model (Pages, Variables, Scope).
Outputs (what you should see)#
Quick mode renders two sections:
1) Composition (categorical obs)#
For each selected composition field:
Quick reports the top 5 categories by count across the selected pages.
It renders a stacked bar where segment widths are percent of cells in those top categories.
It prints the top 3 categories as short labels for quick scanning.
Interpretation notes:
The bar shows only the top categories; the long tail is not shown.
Missing values may appear as
(missing)when present.
2) Statistics (continuous obs)#
For each selected statistics field, Quick reports:
Mean
Median
Std
For very large selections, median/quantiles may be approximate (sampling-based), but the goal is to stay fast and stable.
Fast path (wet lab / non-technical)#
Goal: “Tell me what this group of cells looks like in 2 minutes.”
Create or select a highlight page
Go to Highlighted Cells.
If needed, add a page and put a selection into it.
Open Analysis → Quick
You should immediately see a header like “<PageName>: X cells”.
In Composition, choose fields you care about
Common picks:
cell_type,cluster,sample,batch.
In Statistics, choose QC fields
Common picks:
n_counts,n_genes,pct_mito, or any score field.
Interpret
If composition looks wrong: you may be on the wrong page.
If statistics look extreme: you may have selected low-quality cells or a biased subset.
What success looks like:
the page name matches what you intended,
the cell count is plausible,
composition and QC metrics match your expectations.
Practical path (computational users)#
Quick is aggregated, not per-page#
Quick does not show a per-page breakdown. It computes summaries over the combined selected cells.
If you need:
per-page distributions,
plot customization,
statistical tests,
use Analysis mode: Detailed (variable + plots + statistical tests).
“Effective n” can differ by field#
Composition counts exclude missing values.
Statistics exclude non-finite values (NaN/Inf).
So a page with 50,000 cells may effectively contribute fewer values for a field with missingness.
Edge cases and pitfalls#
No pages exist → Quick has nothing to summarize. Create a highlight page first.
Empty page (0 cells) → header shows 0 cells; sections are empty.
No categorical obs fields → Composition has nothing to choose.
No continuous obs fields → Statistics has nothing to choose.
Huge number of categories → only top categories are shown; use Detailed + Bar Plot for full distribution.
Very small pages (< 20–50 cells) → mean/std are unstable; interpret cautiously.
Troubleshooting (Quick mode)#
Symptom: “Quick is blank / says there are no pages”#
Likely causes:
no highlight pages exist yet.
How to confirm:
open Highlighted Cells and check if page tabs exist.
Fix:
create a page and add cells to it (see Highlighting and Selection (Groups, Pages, Tools)).
Symptom: “Quick shows the wrong group”#
Likely causes:
Quick is in Dynamic mode and a different page is active than you think.
How to confirm:
open Quick’s Page Selection collapsible at the bottom and check the mode indicator.
Fix:
switch to Manual mode and explicitly pick the page(s) to summarize.
Symptom: “Composition/Statistics says ‘No … fields selected’”#
Fix:
use the “Choose … fields” dropdown and select fields.
Interface reference#
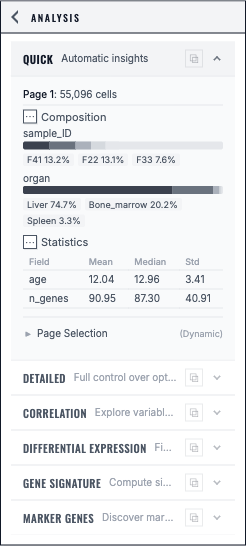
Quick Insights summarizes the selected highlight page with composition and numeric statistics.#
Next steps#
Analysis mode: Detailed (variable + plots + statistical tests) (side-by-side comparisons, plots, statistical tests)
Analysis mode: Correlation (X vs Y across pages) (relationships between variables/genes)
Troubleshooting (analysis) (analysis-wide failures: missing expression, slow DE, etc.)